





You pay for
the SMS you send.
Only delivered ones work
The real price of an OTP isn't the rate-card number. It's the rate divided by delivery rate, plus retries, plus paid statuses, plus a separate vendor for every region. Calculate your own effective price per delivered message — and find out how much of your messaging budget goes nowhere every month.
Four traps that turn a 'cheap' vendor into an expensive one
'Our rate is below market'
A lower rate often means cheap grey routes with low delivery. You save a cent on the rate — and lose payments, because the codes never arrive.
What's the effective price per delivered message on each of my geos — rate ÷ delivery rate?
'Our delivery rate is 95%+'
An all-routes average hides the failures: 99% in Germany and 70% in Nigeria net a 'respectable' 95% — while your losses sit right there in Nigeria.
Show me per-carrier DLR stats on my top-10 routes, not the average across everything.
'Retries are all about delivery'
A retry on the same SMS channel over the same route is a second paid message with the same odds of not arriving. You pay twice for one non-delivery.
Is there failover to another channel (Viber, Voice) — and what does it cost?
'A local vendor for every region'
Three vendors = three minimum commitments, three integrations, three dashboards, and zero negotiating leverage with any one of them.
How much does an engineer-hour cost to maintain each extra integration per year?
How much budget burns on undelivered SMS
-
Every undelivered one is paid for
At 8% non-delivery you're paying for ~1 in 12 messages that are guaranteed to fail.
-
Retries double the cost of non-delivery
A typical flow makes 1–2 resends — all of them paid.
-
And the headline number is bigger still
An undelivered OTP is a lost transaction. The direct SMS cost is only the tip of the iceberg.
Overpayment calculator
We don't 'undercut on rate.' We remove the overpayment
Direct routes
MNP Lookup
Channel cascade
One contract
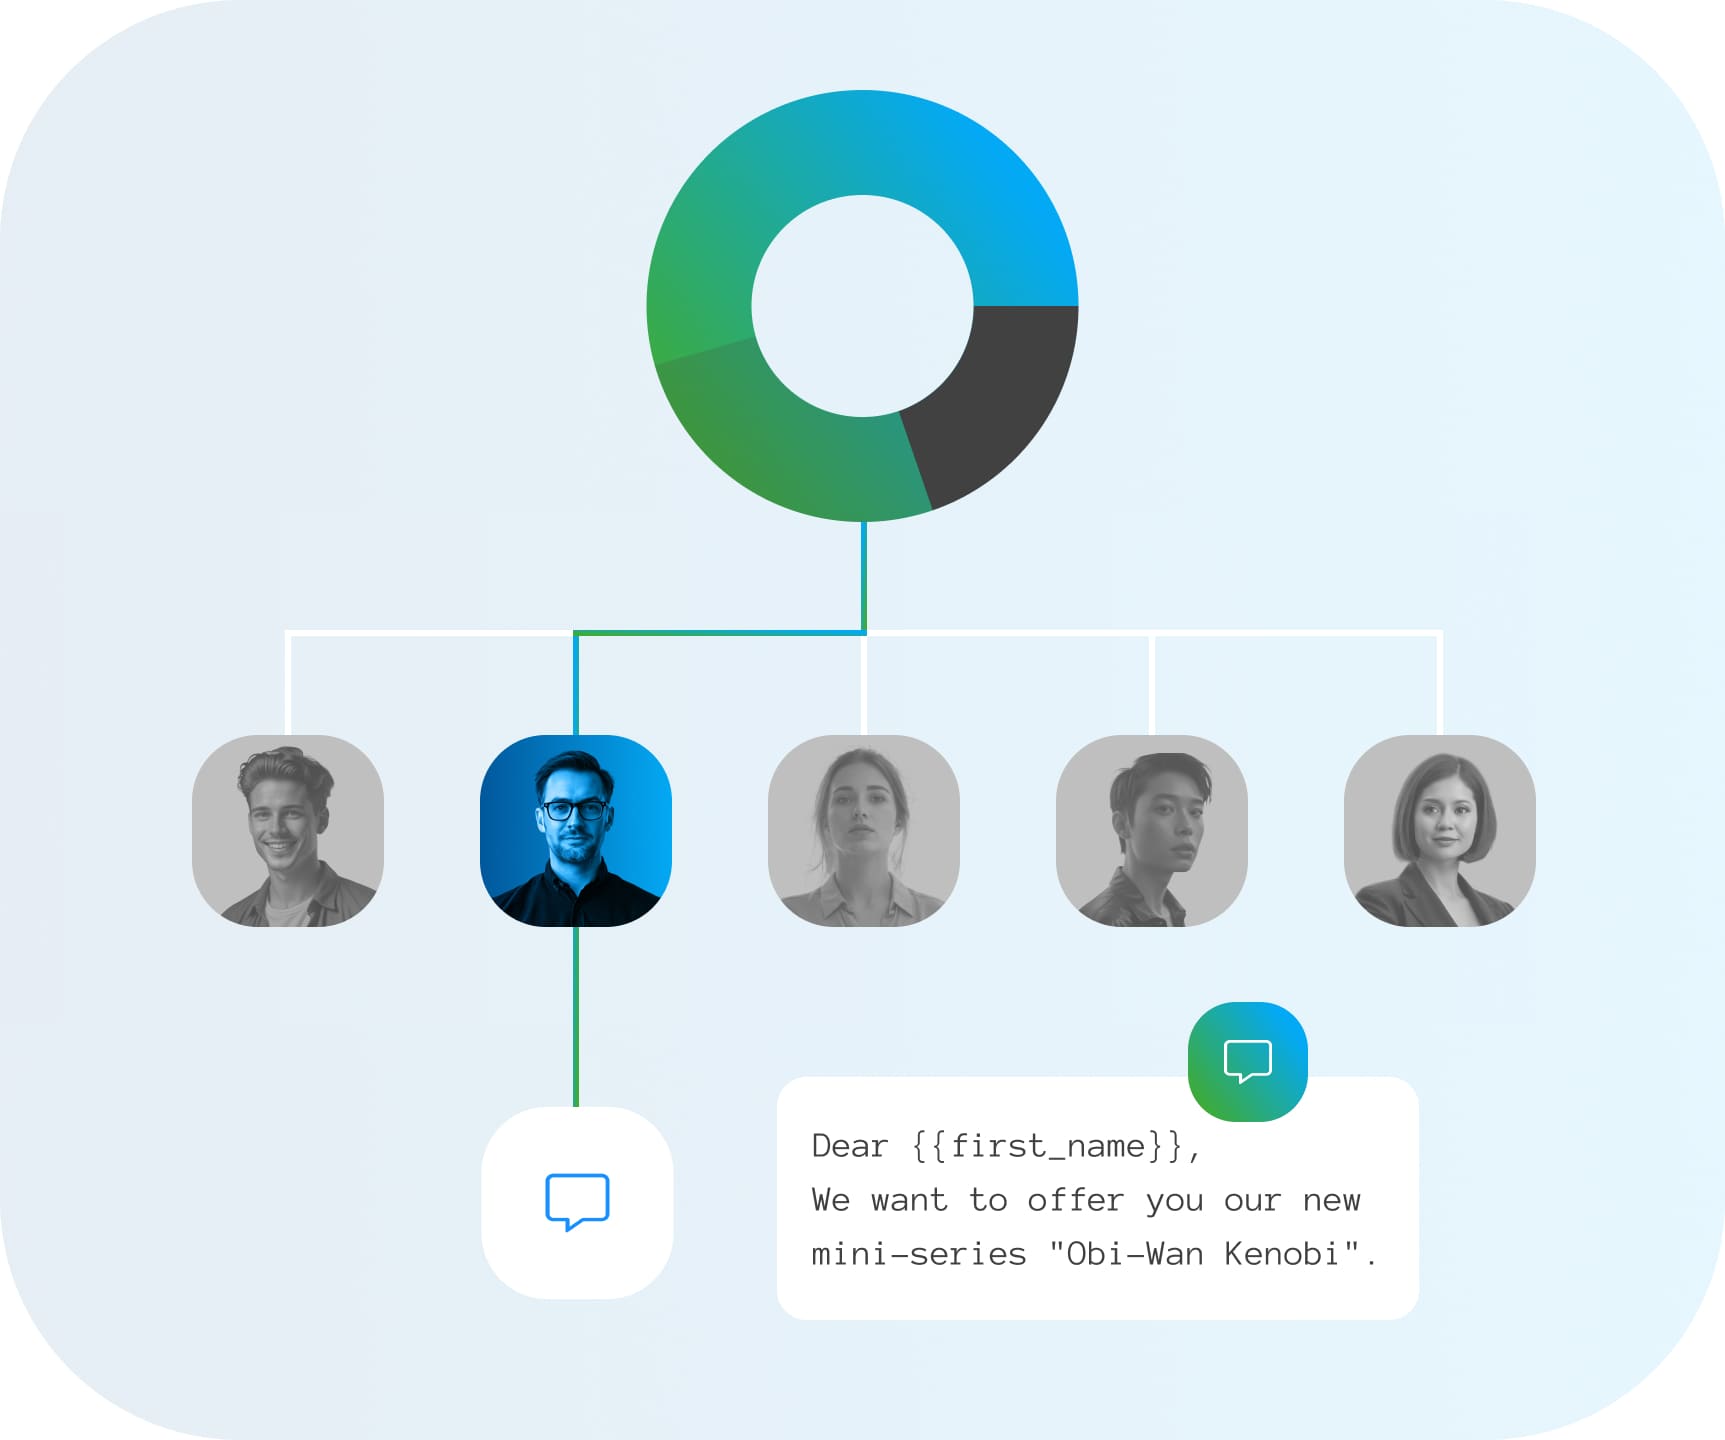
Fewer middlemen — a fairer price per delivered
800+ operator routes across 200+ countries. High first-attempt delivery means you pay for messages that work — and pay for retries far less often.
Compare rates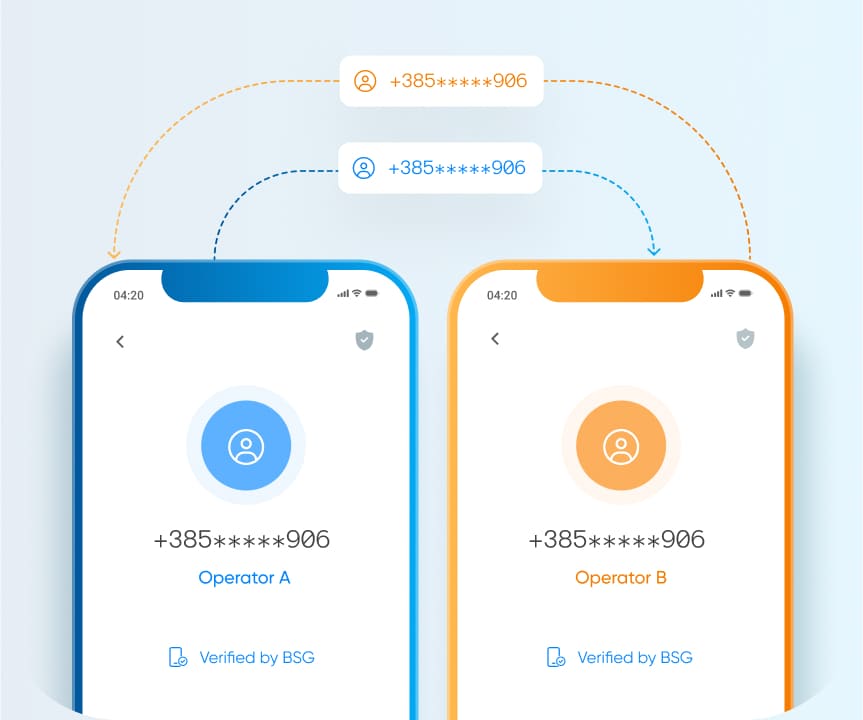
Stop paying to send 'into the void'
Checking the current operator before sending: ported and non-existent numbers stop eating budget. A fraction-of-a-cent lookup instead of a paid, undelivered SMS.
Compare rates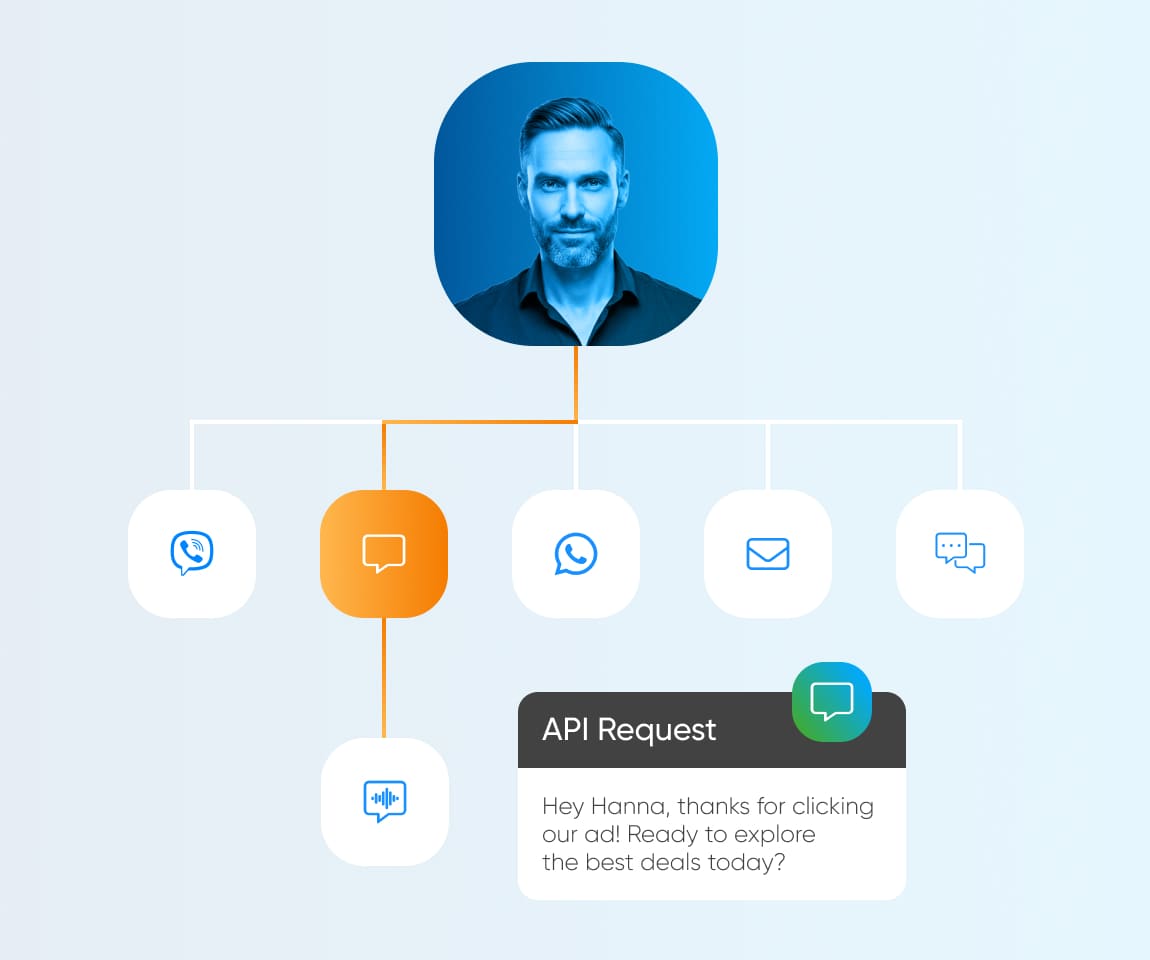
Failover to a cheaper channel, not a double SMS
Instead of a second paid SMS — Viber (materially cheaper in a number of geos) or Voice. A smart retry costs less and delivers better.
Compare rates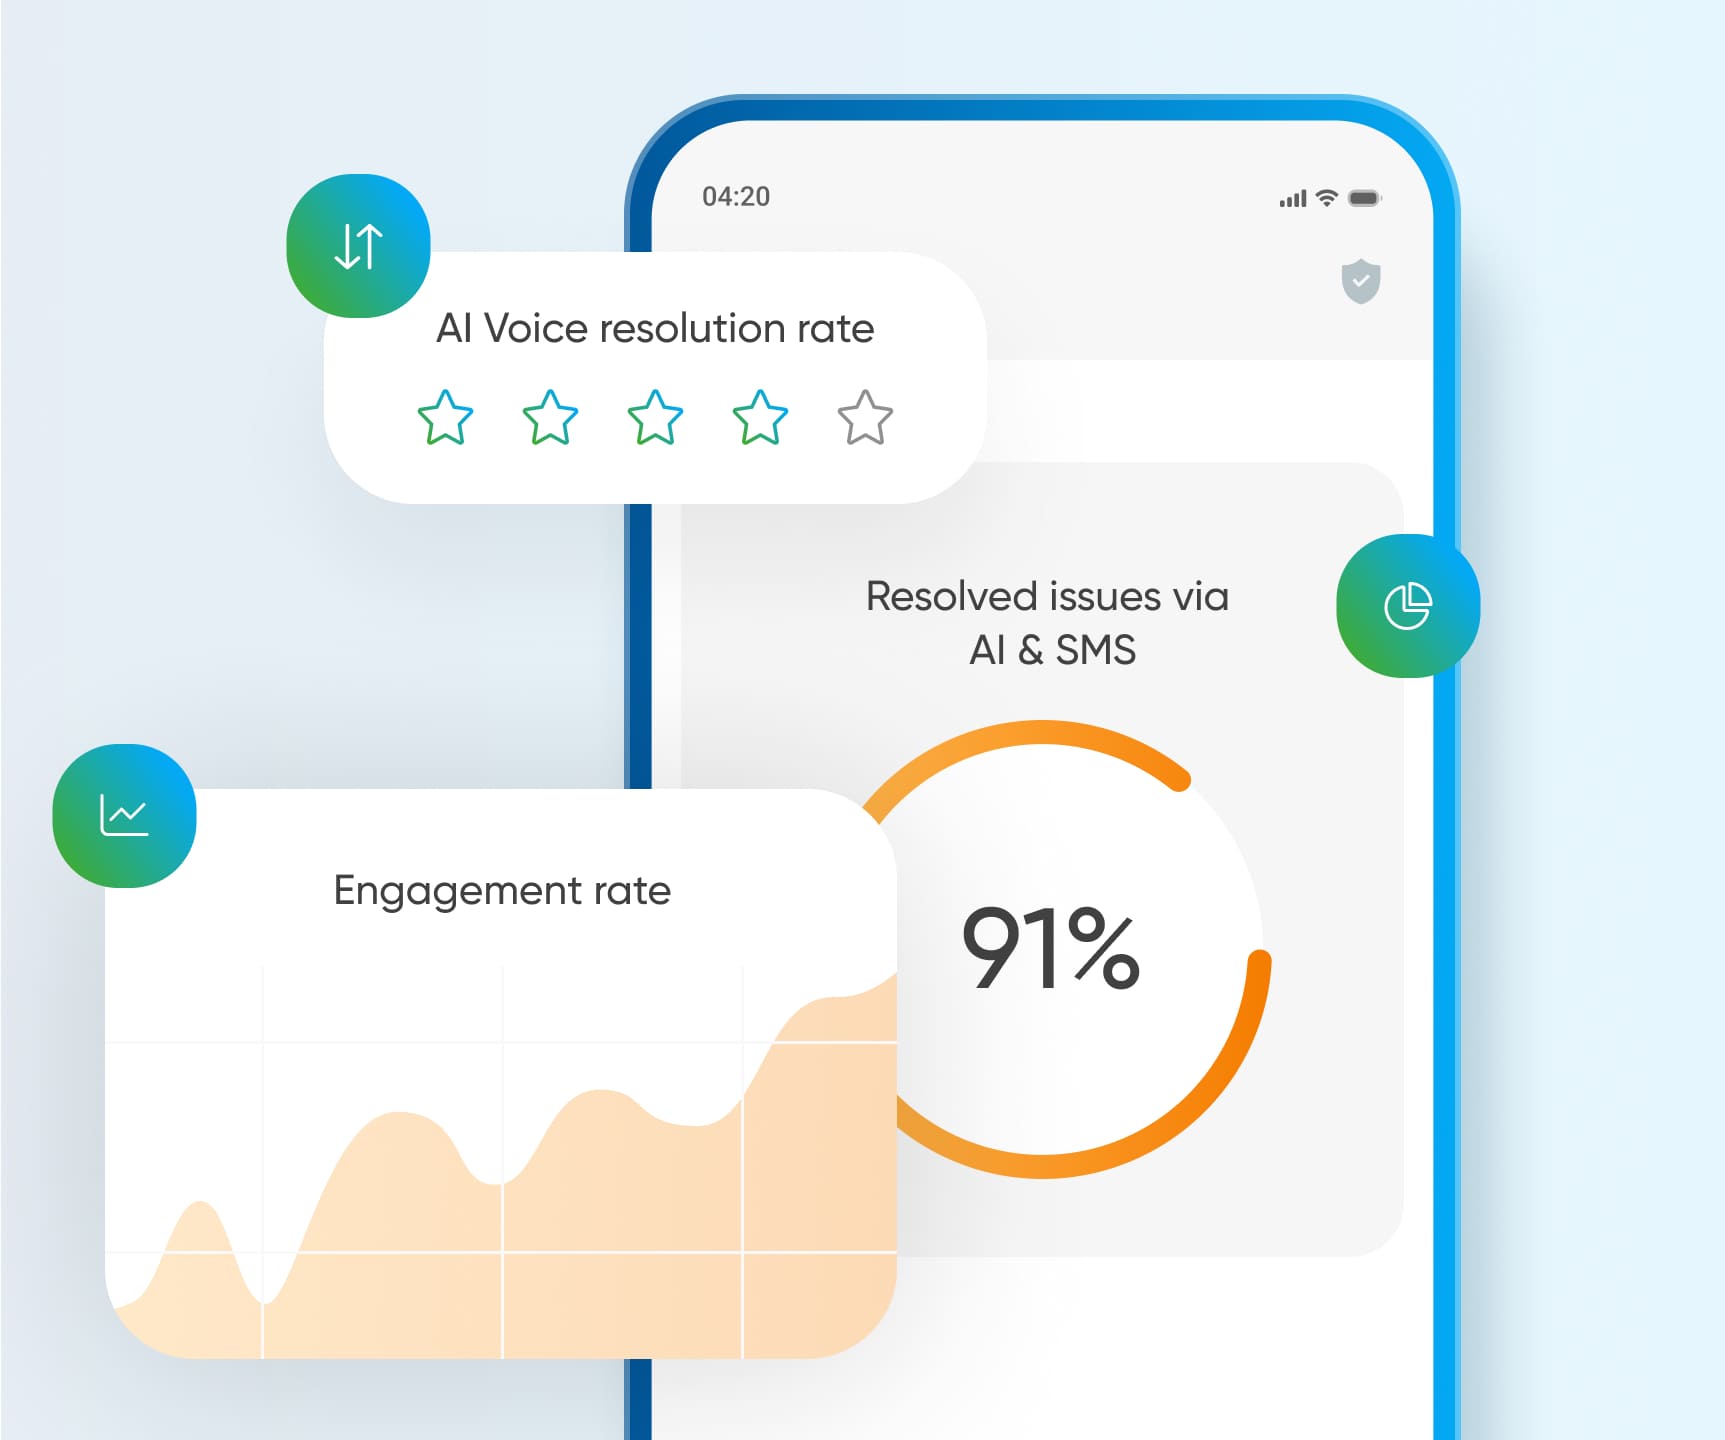
Volume consolidation = negotiating leverage
All your multi-region traffic under one contract: one volume for lower rates, one integration instead of three, one SLA and one point of accountability.
Compare ratesWhat people usually ask before comparing
How do you count 'delivered'? Can it be verified?
By operator DLR (delivery receipt), broken down per-carrier and per-country, available to you in real time in the dashboard and via API. In the rate comparison we show the calculation methodology — you can verify every number on your own test traffic before any commitment.
We're in an annual contract with our current vendor. Any point in running the numbers now?
Yes — right now. A rate comparison pays off 3–6 months before renewal: it's either leverage in talks with your current vendor (also money) or a ready-made business case for switching. And you can run a parallel test on a single geo without breaching your contract — most deals aren't exclusive.
Minimum volumes, commitments, platform fees?
Pricing is billed on actual traffic per route. Volume terms are agreed individually and locked into the contract alongside the SLA; there are no hidden 'platform' or 'support' fees. Every component of the price is right there in the comparison — the same table as the rates.
How painful is the switch, technically?
REST API with docs and a sandbox; if you're integrated with any major CPaaS, migration is swapping endpoints and mapping statuses — typically up to two weeks for a single engineer. The standard path is a parallel launch: one geo first, then expand on the results.
What if your rates turn out to be no lower?
It happens — on Tier-1 routes, for instance, where your pricing is already strong. In that case you get an honest table that shows it, plus proof your current vendor is competitive (a valuable result in itself). Savings most often hide in Tier-2/3 geos, MNP filtering, and cascading retries — which is exactly why we cost every route out separately.


Free calculator: enter your volumes and delivery rate — get the monthly loss figure per geo
Undelivered OTP costs more than the message: abandoned sign-ups, failed payments, retries through a second vendor. The model counts all of it.
Delivery rates by region are pre-filled — overwrite any of them with your own data.

By clicking the button, you consent to your data being processed to answer your request.
Useful Materials
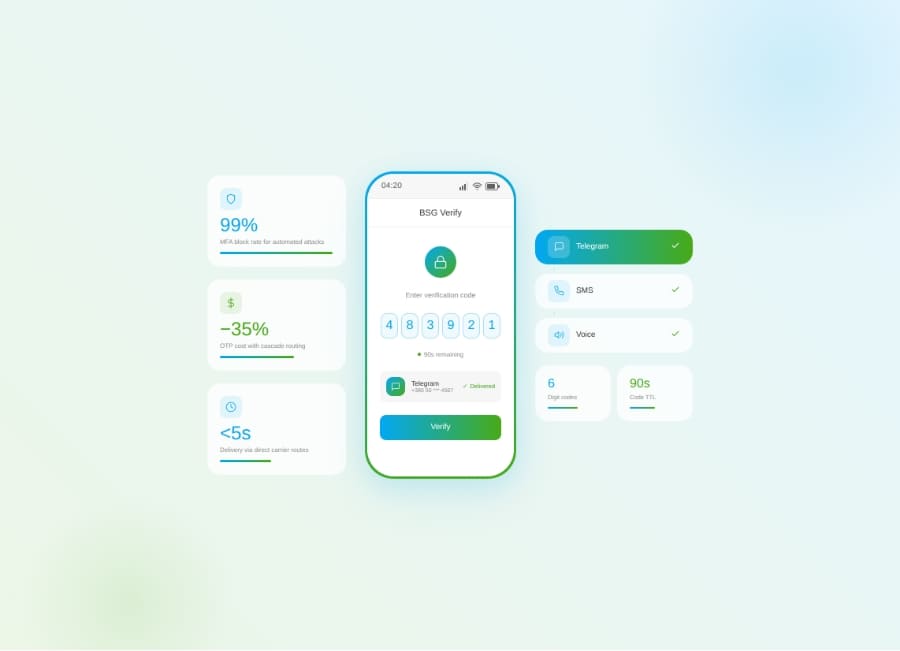
OTP means one-time password — see how it works, compare delivery channels, and cut verification costs with cascade routing.

Are you a fan of online gaming and betting or do you have an iGaming
Fraud and data theft continue troubling online services, costing them huge losses. The estimated cybercrimes